DDF Rainfall data
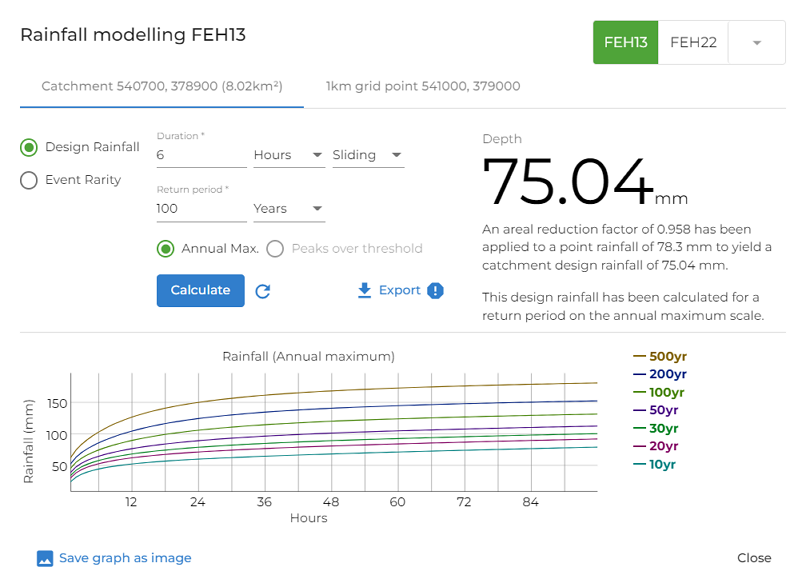
The DDF Rainfall window
Once you purchase a catchment or a point data, you can access the DDF (depth-duration-frequency) Rainfall window via the blue Rainfall button  . For an explanation of the DDF models, see DDF Science Overview.
This window allows you to perform DDF calculations for the selected catchment/point as well as for the 1km grid cell closer to the catchment outlet, with an interactive graph displaying the most common return periods.
Advanced parameters are available, for example, the choice between annual maximum (AM) and peaks-over-threshold (POT) return period scales, and fixed and sliding event durations. For certain combinations of depth, duration, or return period, the screen will automatically a particular set of options, according to best practice and/or the constraints of the underlying models. For example, setting a return period of 6 months will disable the AM return period scale option and switch to POT.
Choose between the FEH13 and FEH22 DDF models using the switch in the top right side of the windows. The legacy FEH99 DDF model is available using the switch drop-down button. Note that FEH99 is only available for catchment data.

Rainfall export
With the Design Rainfall mode selected, rainfall data can be exported to CSV by clicking the Export button. The rainfall data is output as a matrix of depths for standard return periods and durations. The export will vary slightly depending according to whether the user has first entered a duration and return period and performed a depth calculation (by clicking the blue Calculate button). If they have, extra header lines are added to the CSV file with details of the precise calculation performed. If a return period has been used that is not one of the standard return periods an extra column will also be added to the output containing depths for the custom return period.
Please note that third party tools that are able to import FEH Web Service rainfall CSV data may not work correctly with the extra data present. In this case it is suggested to press the Reset  button to clear any current calculation parameters and perform a basic export.