Summary
The FEH22 rainfall depth-duration-frequency model is UKCEH’s latest rainfall frequency estimation model, released in December 2022. FEH22 maintains the methodology of the FEH13 model, while adding substantially to the period and spatial density of calibration data. Coverage for shorter durations, down to 1 hour, is particularly increased.
Improvements over FEH13 (and legacy FEH99 and FSR)
FEH22’s calibration dataset offers several improvements over FEH13’s, as well as those of FEH99 and the FSR. Firstly, the quantity of rain gauges available for calibration at both daily and hourly resolution is greatly increased: by 24% and 107% respectively. The temporal coverage is also increased by 15 and 11 years for daily and hourly resolution data respectively, allowing recent extreme events to be included in FEH22 model calibration. Secondly, the increased spatial density of gauging means that frequency relationships for given event rarities at a site are derived from closer gauges; this also has the effect of reducing the radius of influence of extreme events. Thirdly, UKCEH worked with the UK measuring authorities to review the gauging accuracy of extreme rainfall events, including many that were used in previous models, leading to improved representation of these events in the calibration dataset. In practice, this often meant a reduction to the rainfall depth, or a complete exclusion of the event. Differences between FEH22 and FEH13 are greatest for longer return periods, as these require the most extrapolation from gauged data in either method.
FEH22 and FEH13 Differences
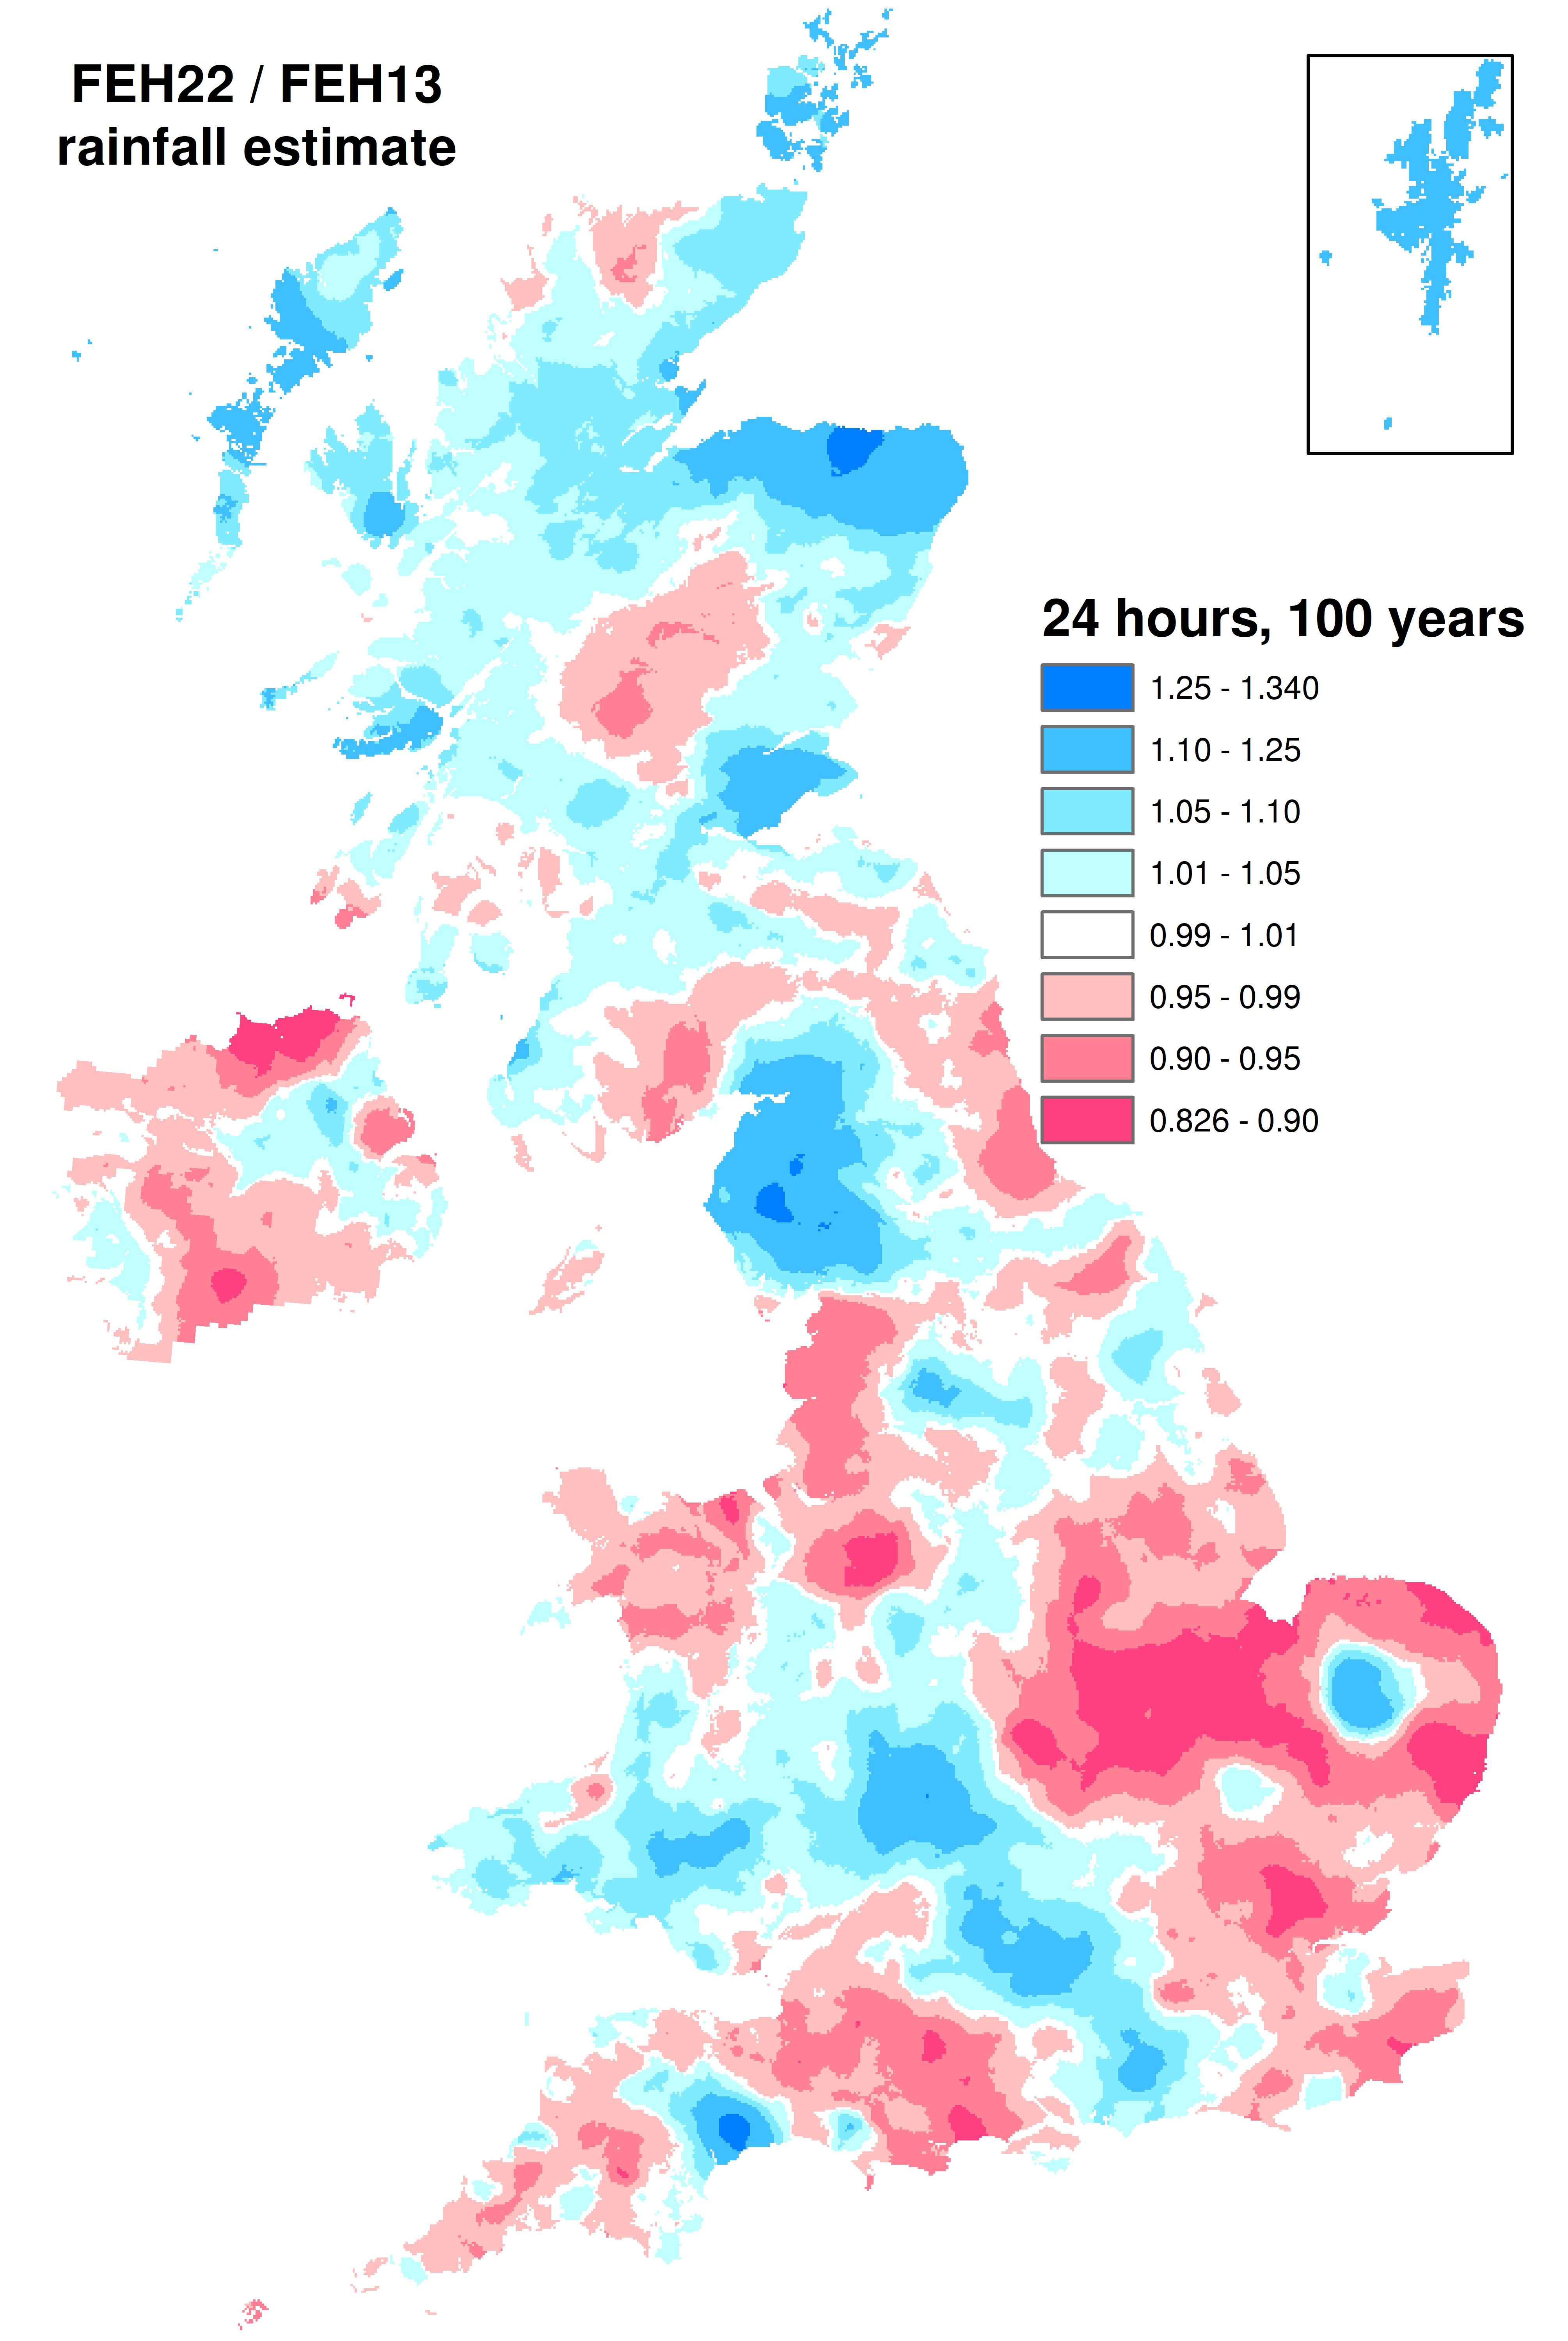
The below maps present the FEH22 rainfall depth as a fraction of the FEH13 rainfall depth for five durations (1, 6, 12, 24 and 48 hours) and the 30 and 100 year return periods. Blue shades represent areas where the FEH22 estimate exceeds the FEH13 estimate, while red shades indicate the opposite.
Differences between FEH22 and FEH13 are greatest for shorter durations, where the quantity of data is most increased over FEH13, and for longer return periods, where the differences found at shorter return periods are often magnified. FEH22’s largest increases occur at the sites of extreme events that were not captured by the FEH13 calibration dataset, either because they occurred after 2006 (e.g. at Seathwaite Farm/Honister Pass in 2009/2015) or because they were captured by a gauge that is exclusive to the FEH22 dataset (e.g. at Alltdearg House, Skye). Because of the spatial pooling method used to develop rainfall frequency relationships, FEH22 estimates can also increase over FEH13 estimates at sites that are within the radius of influence of extreme events. FEH22’s largest decreases occur at and near sites where extreme events that were included in the FEH13 calibration dataset (and potentially earlier datasets) were either modified or removed from the calibration dataset during quality assurance of the FEH22 model calibration dataset (e.g. in mid-Wales).
Further information, including maps for three additional return periods (2, 200 and 1000 years), is available in Vesuviano, G. (2022).
| 30 years | 100 years | |
|---|---|---|
| 1hr | 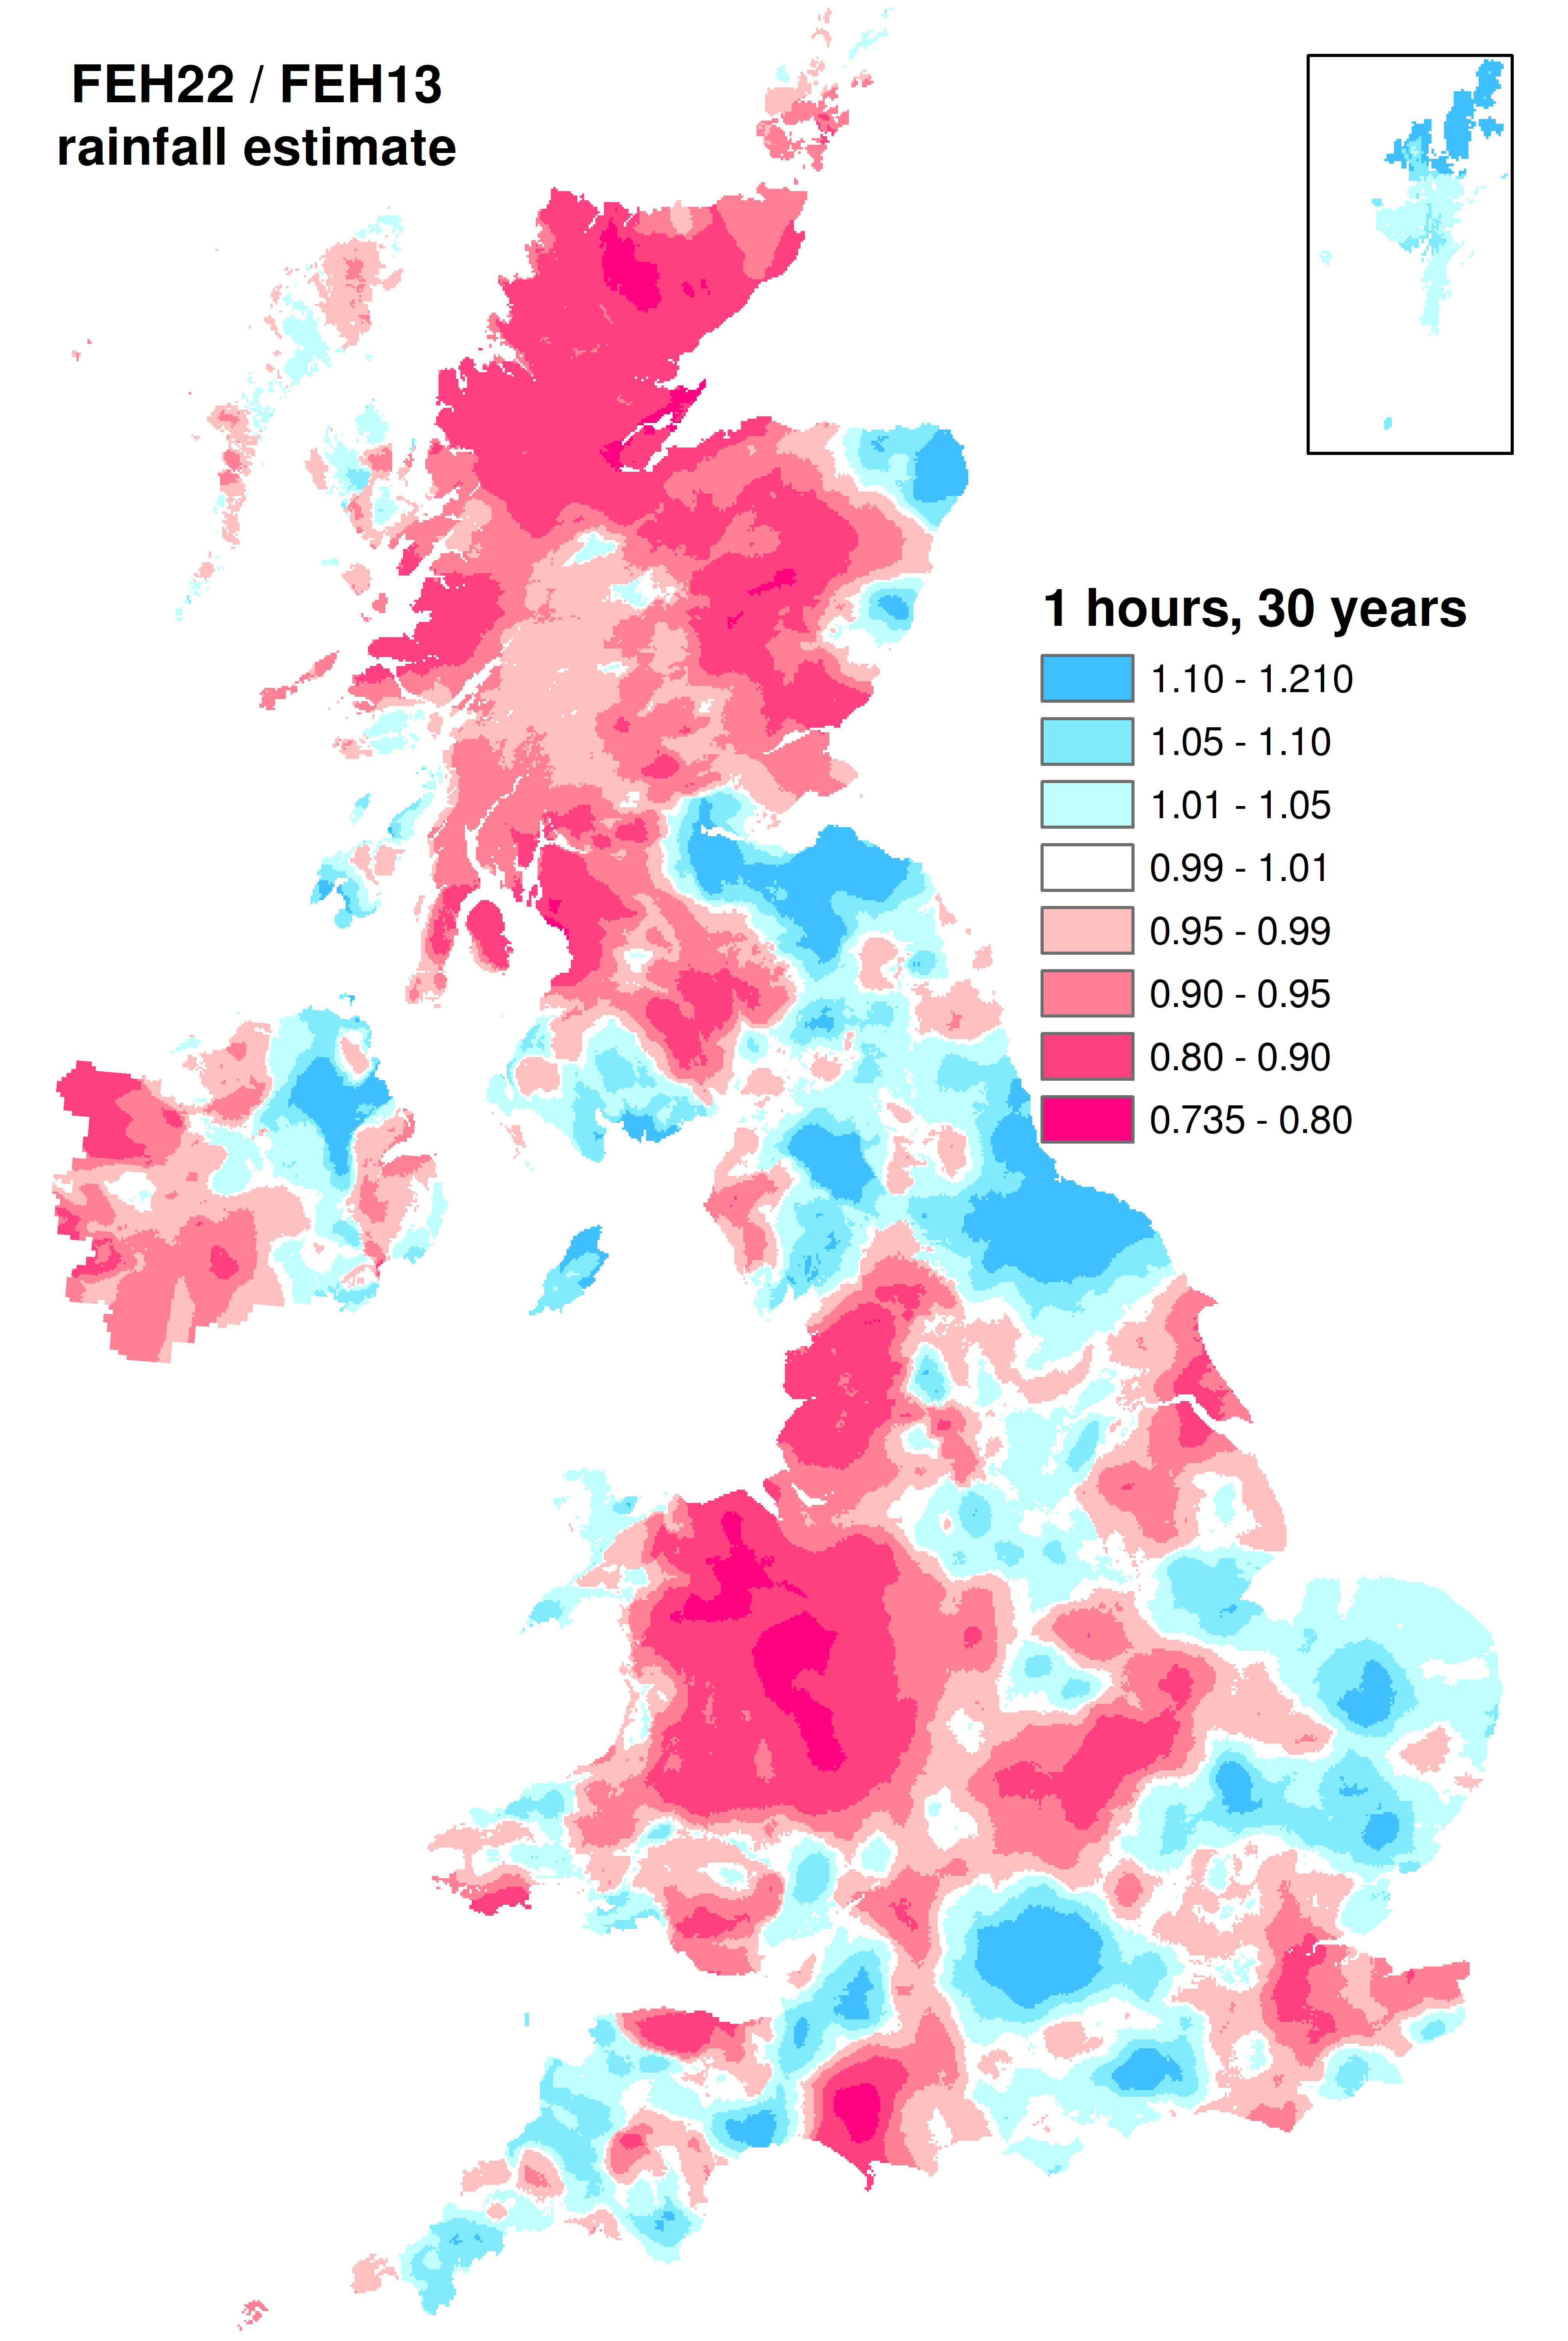 |
 |
| 6hr |  |
 |
| 12hr | 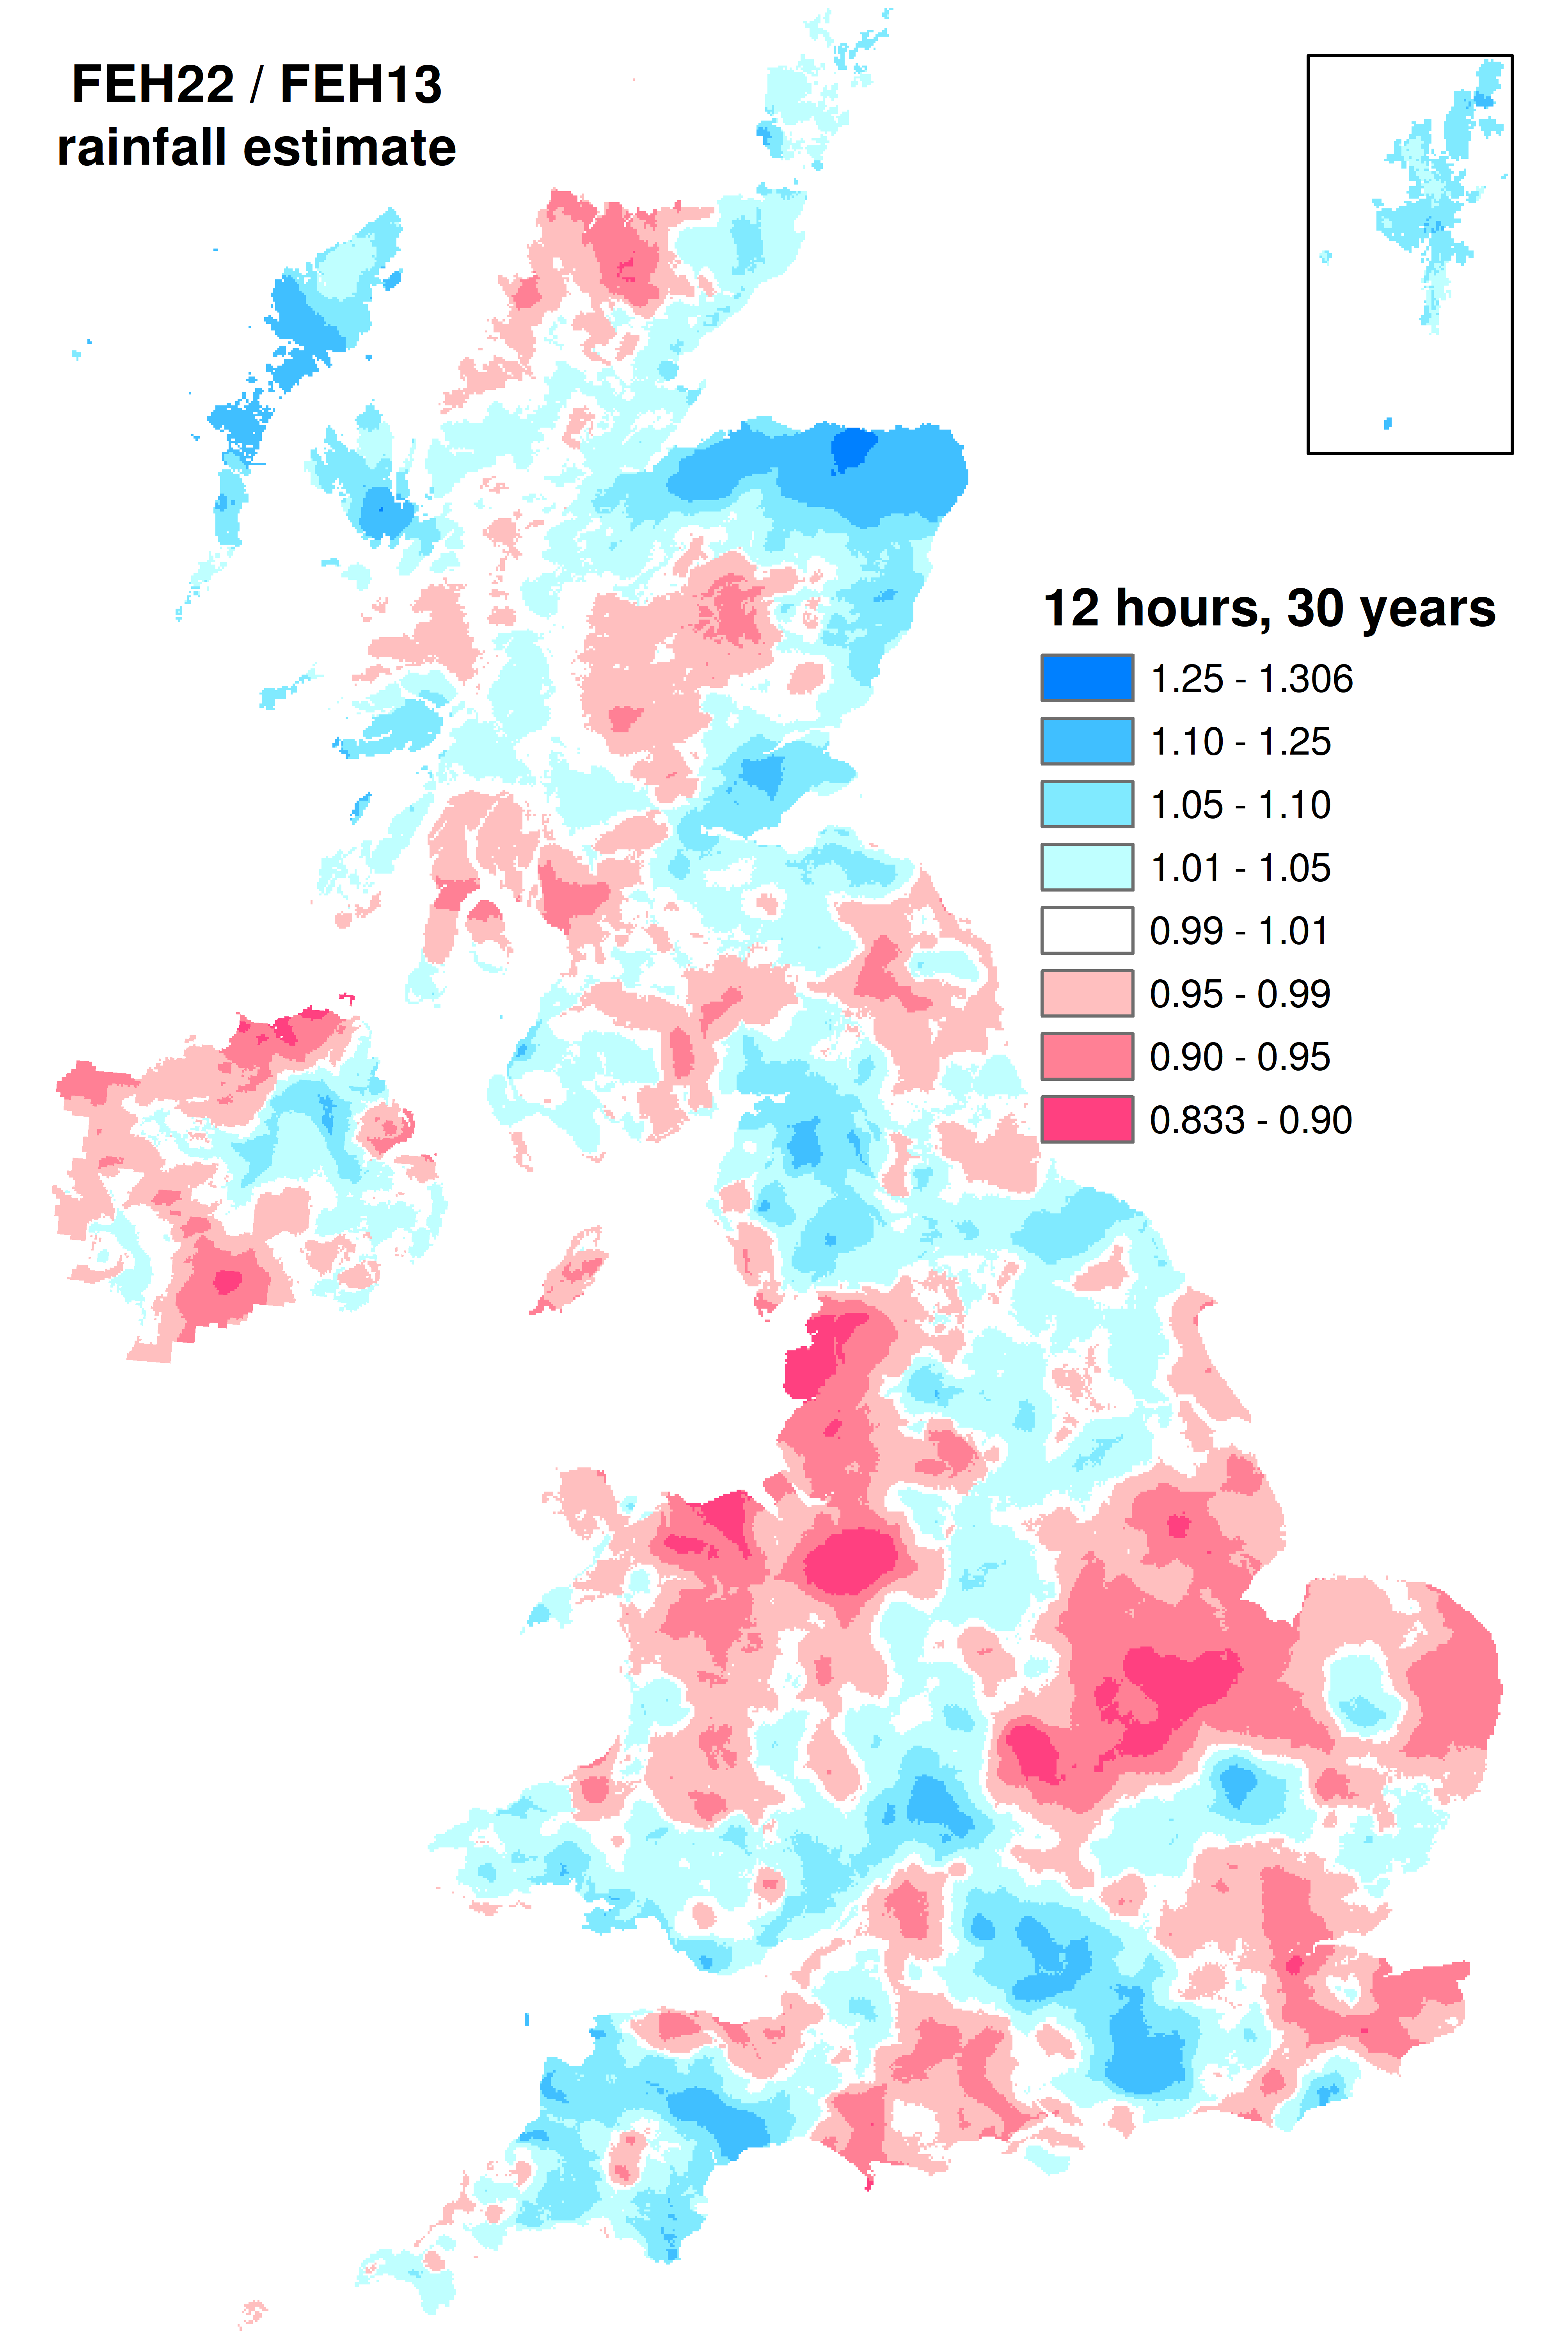 |
 |
| 24hr | 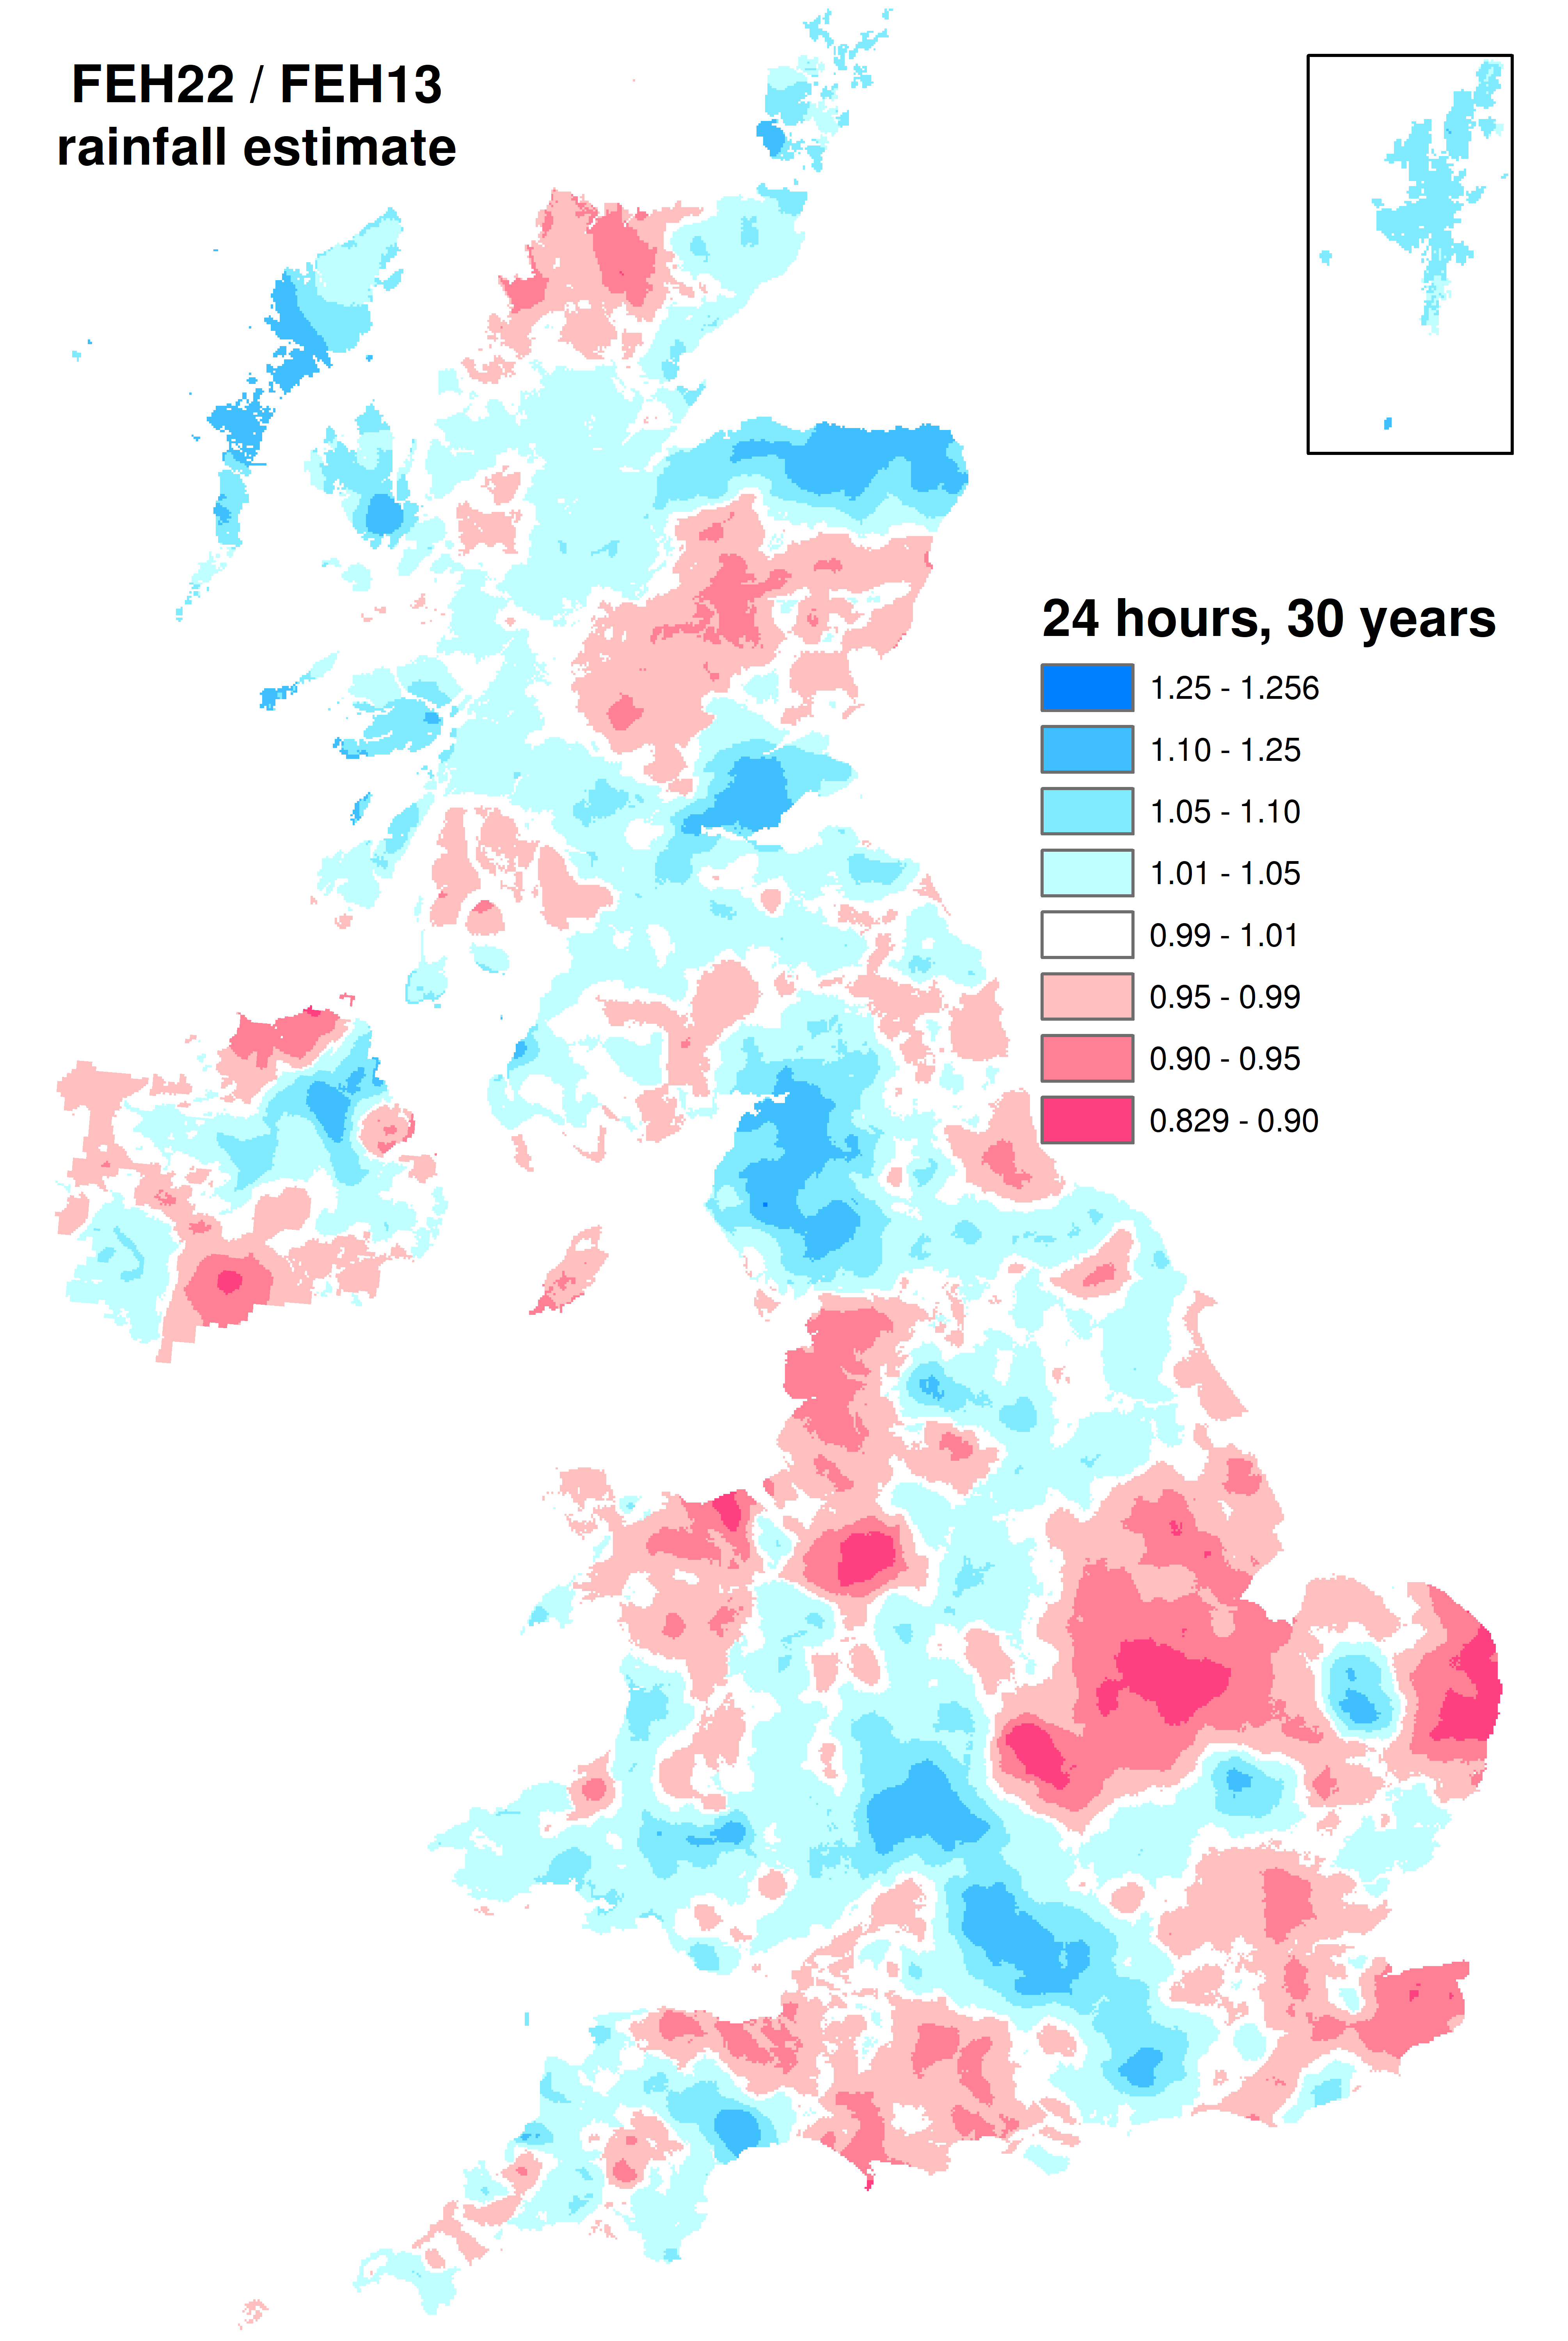 |
 |
| 48hr |  |
 |